Problems with axis limits? #3948
Description
I believe I have some trouble when setting axis limits. The first is with scale_y_continuous():
# data
library(ggplot2)
ylim <- c(6, 30)
obs1 <- data.frame(
Time = 1:20,
Group1 = rep(c("G", "H"), times = 10),
Group2 = rep(c("A", "B"), each = 10)
)

obs1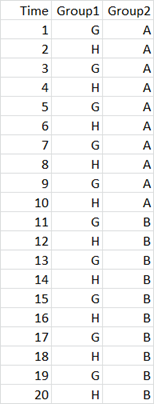
# bars not displayed if 0 is not in the ylim range (test ylim = c(-1, 30))
# The problem is reported with a warning: all the values are removed when 0 is not in the range
p <- ggplot(data = obs1, mapping = aes(y = Time, x = Group2, fill = Group1))
p +
geom_bar(stat = "identity", position = position_dodge()) +
scale_y_continuous(limits = sort(ylim))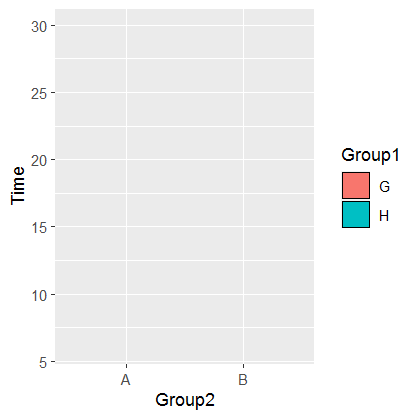
# bars displayed whatever the ylim range
p +
geom_bar(stat = "identity", position = position_dodge()) +
coord_cartesian(ylim = sort(ylim))
The reason why I use coord_cartesian(ylim = sort(ylim)) in most of my functions. However, I encountered a new problem:
# y-axis disappearing
p +
geom_point() +
coord_cartesian(ylim = sort(ylim)) +
scale_y_reverse()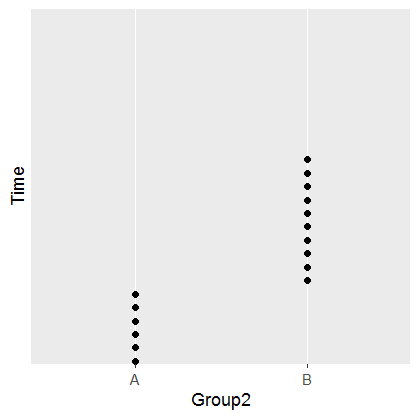
# y-axis not disappearing
p +
geom_point() +
scale_y_continuous(limits = sort(ylim)) +
scale_y_reverse()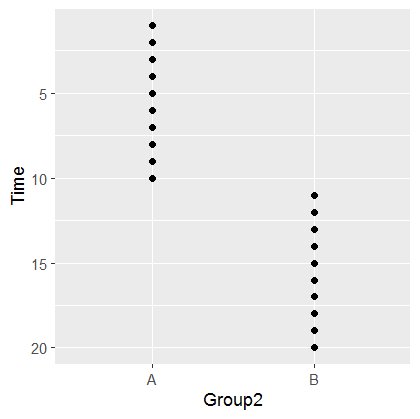
Are all these expected ?
Many thanks for your help.
Best.